 a journal of interesting technical ideas . . .

My office sits beside an Interstate and generally the Interstate corridor is one of the best places to find cellular coverage. Sure enough, we have towers reasonably close to the east and west of the building along the Interstate. The construction of the buildings, like many office buildings, has a strong steel and concrete “core” with open office space around the perimeter. My analysis is that those cores, along with the way the buildings set next to each other, creates 5G/LTE shadows within the buildings.
My buildings are setup along “modern” cubicle-farm ideas. To get a feel for where the dead zones are, I got readings on signal strength using my phone at all the cube row intersections. Wireless signal strength is denoted in decibel-milliwats (dBm). A decibel is a comparison of two numbers, with a 10dB difference translating as a 10 fold increase. A 100x difference would be 20dB. dBm compare a signal to a milliwat.
For LTE, signals weaker than -85dB are poor service. 5G uses newer radios and can do pretty well down to -105dB. T-Mobile, through the acquisition of Sprint, uses low and high bands (800 MHz, 1.9 GHz, and 2.5 GHz) and the lower frequencies penetrate obstructions better (remember how Nextel used to work everywhere?). Verizon and AT&T use higher frequencies and don’t penetrate building interiors as well. Work uses Verizon, so helps explain the reception issues.
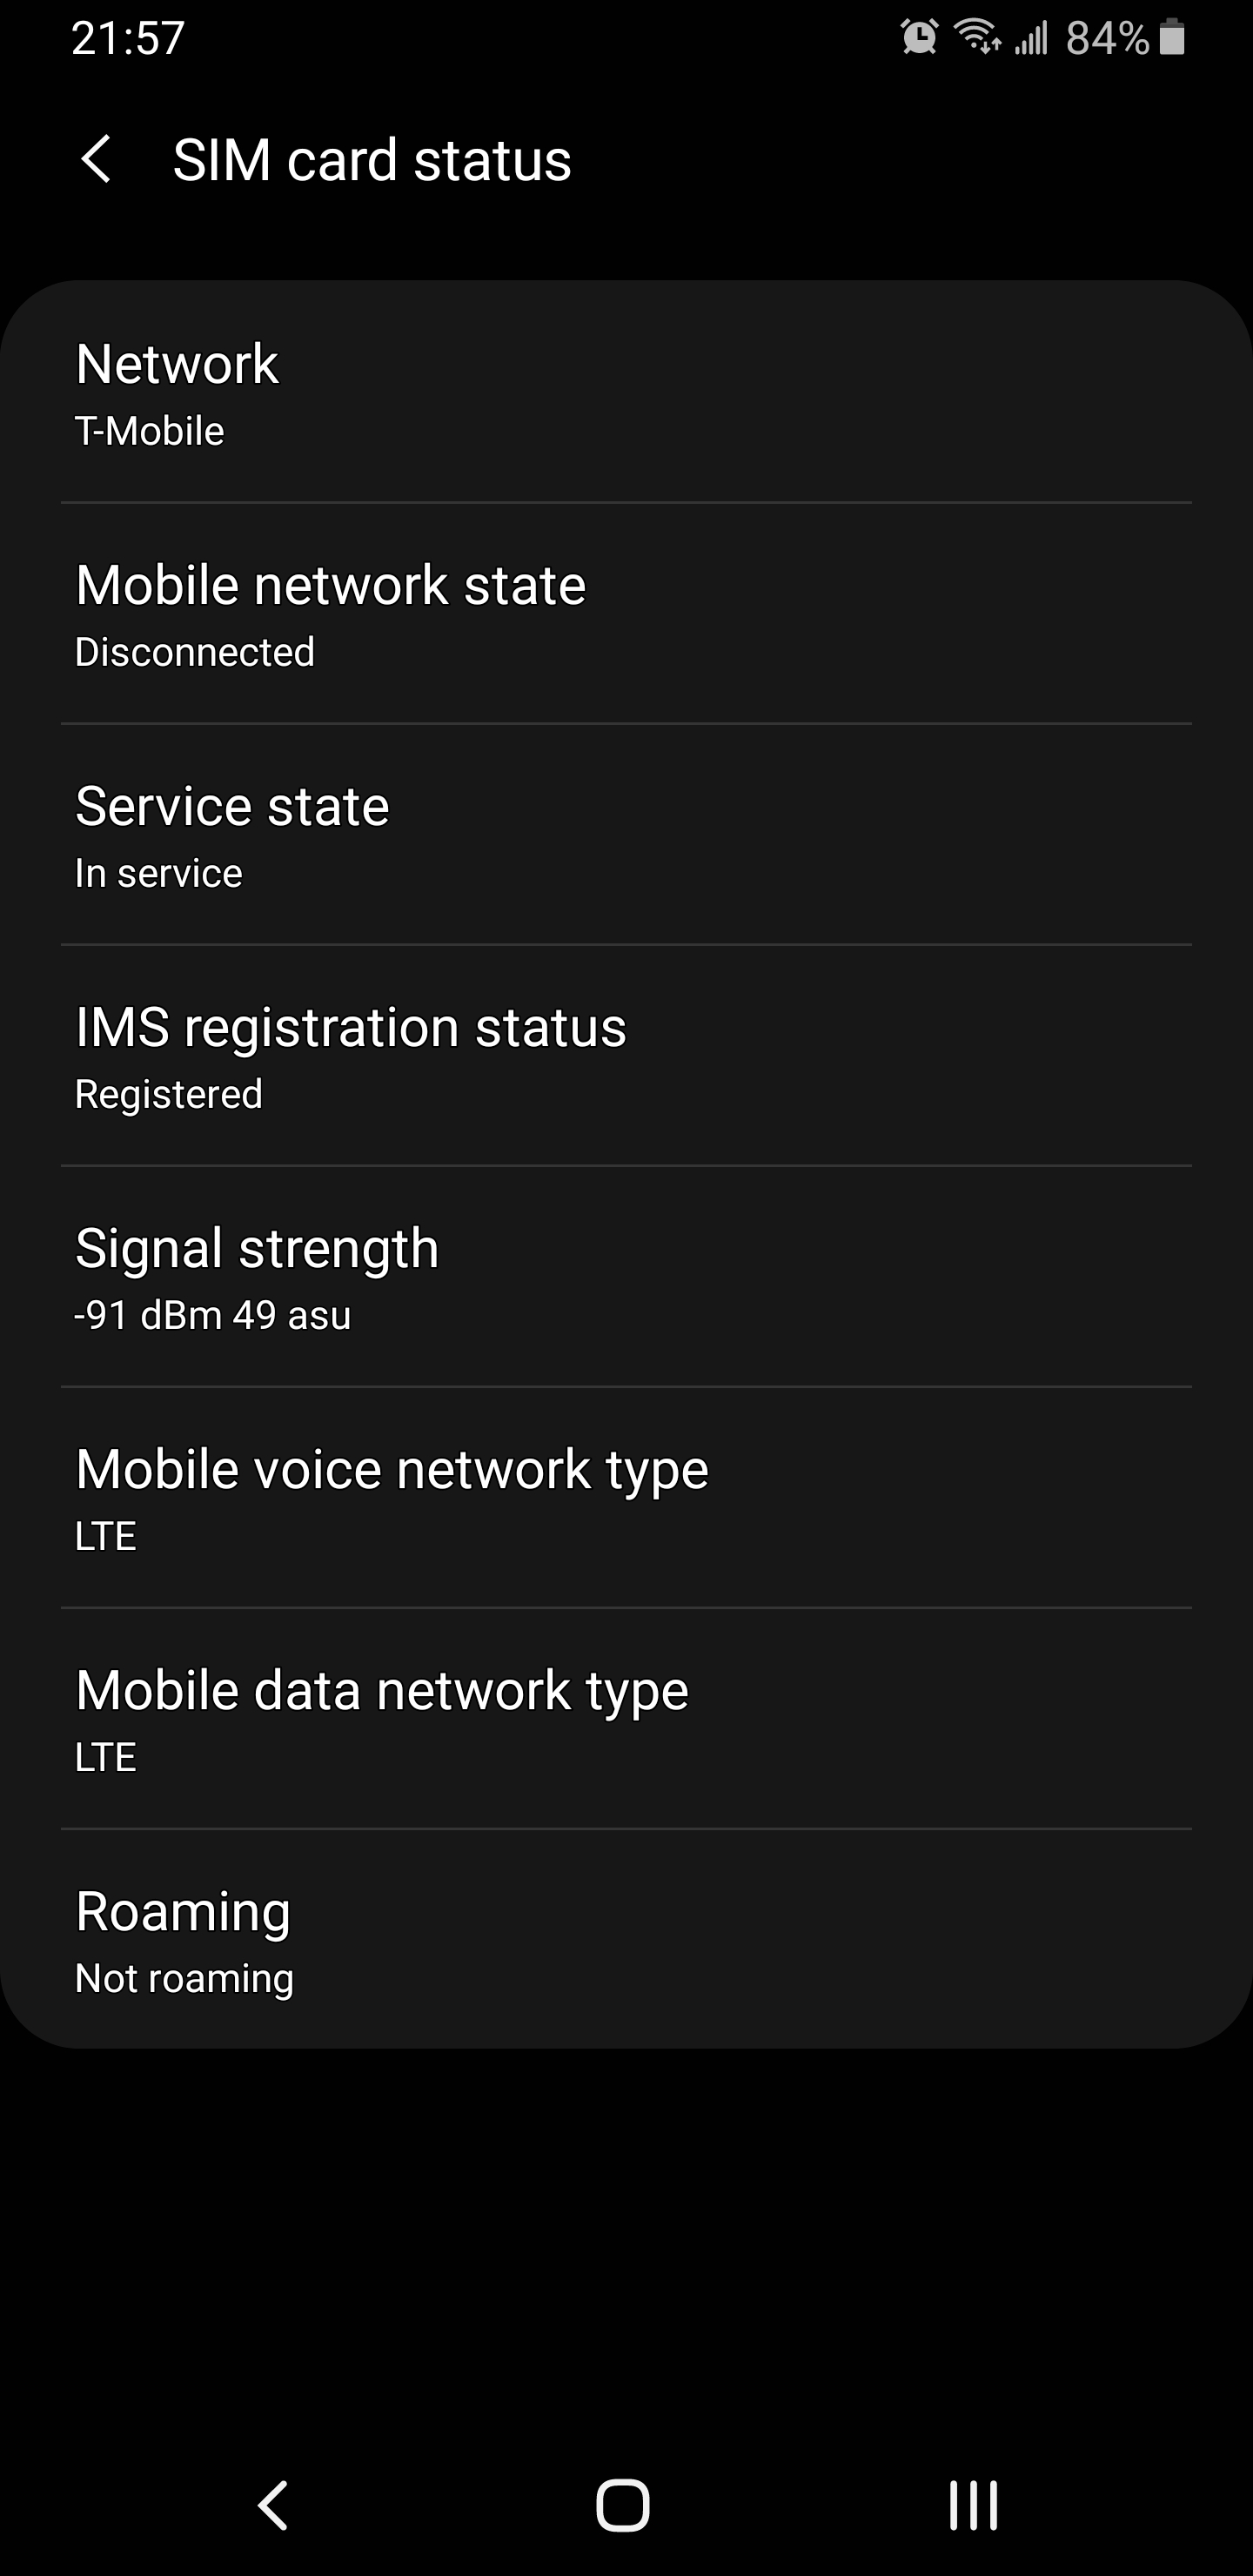
Using Android, you can find signal strength under Settings > About Phone > Status > SIM card status. In my testing this display updated dynamically, so I could just leave it up and walk around. In the example pictured, my signal strength is -91dB on my LTE phone.
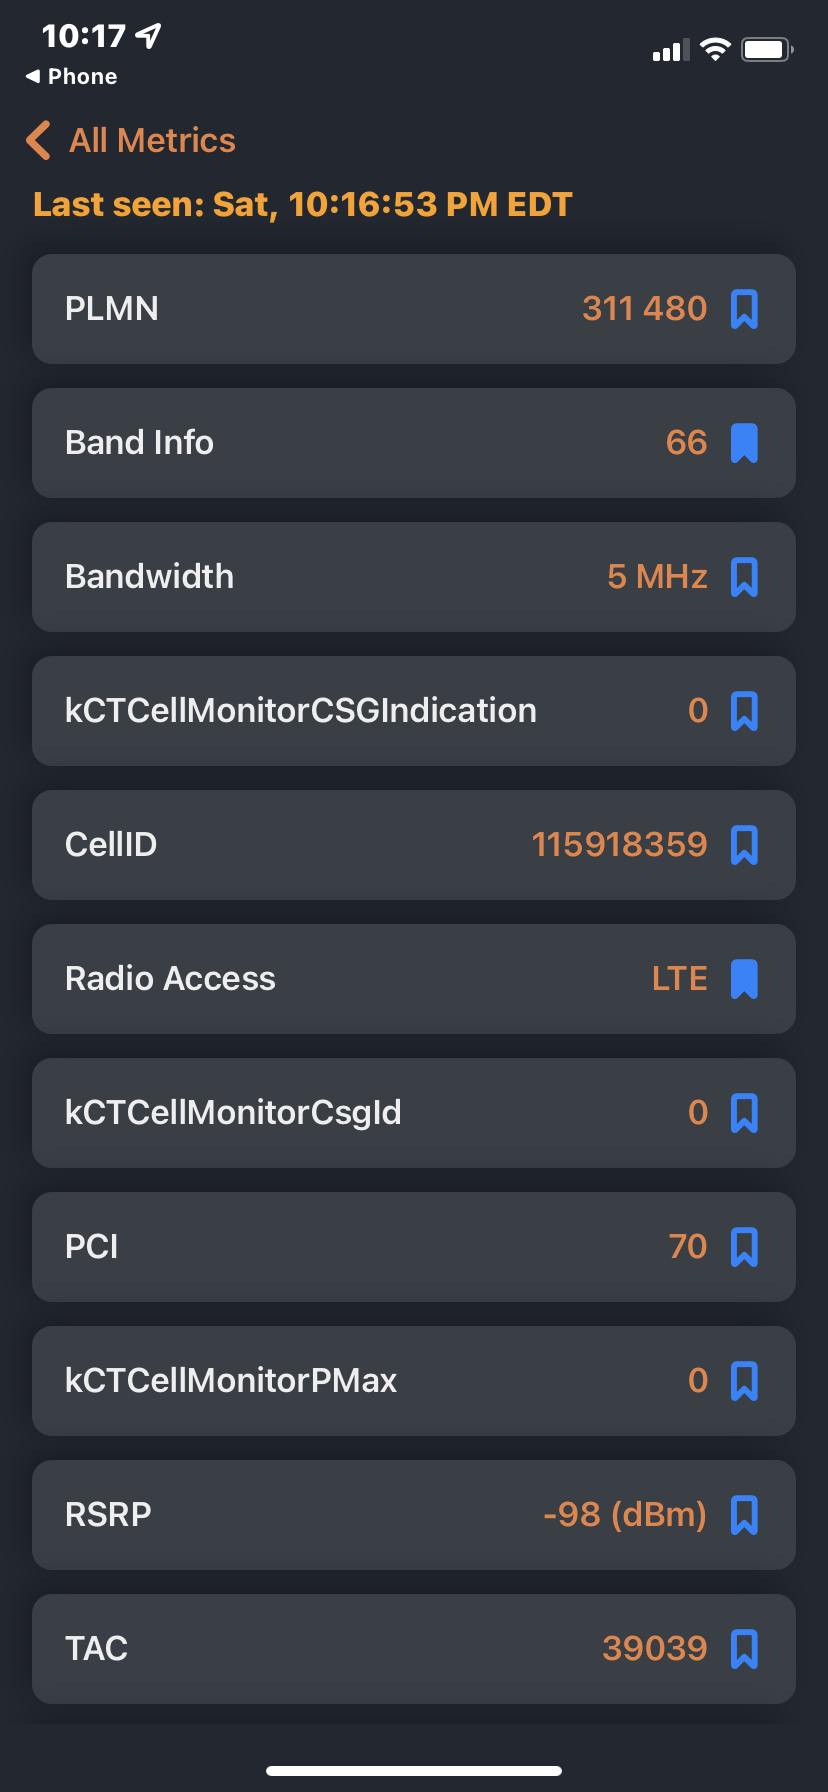
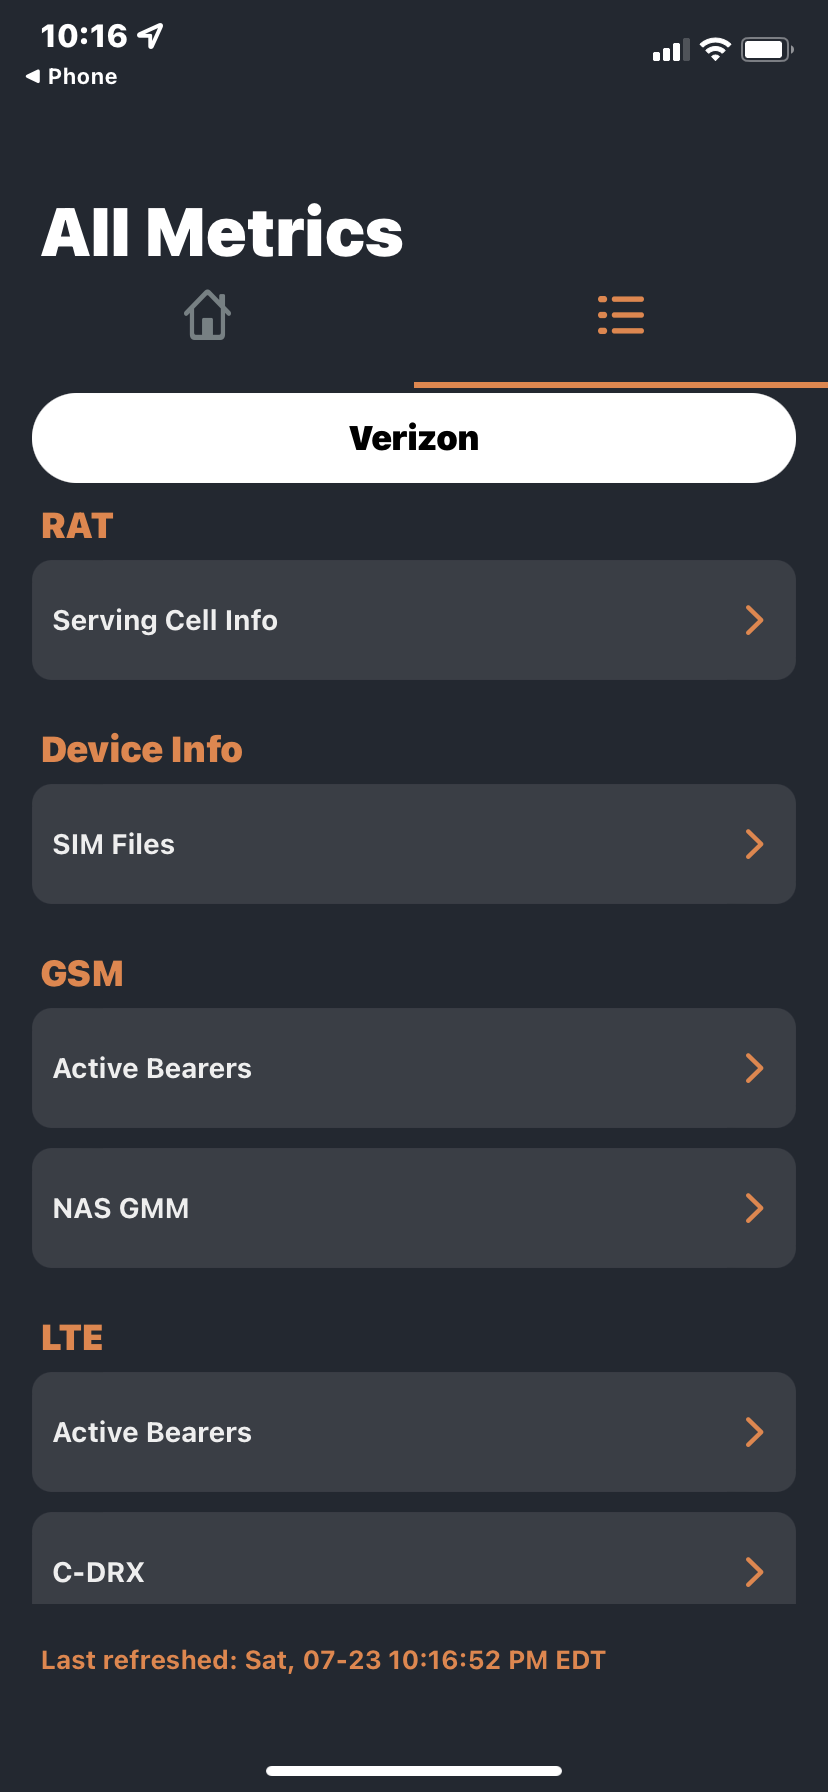
On an IOS device, dial 3001#12345#. This brings up some technician information. Go to the second tab and choose RAT > Serving Cell Info. The signal strength is labeled RSRP. In my experience, this display updates over minutes. If readings are needed faster, just redial the number to refresh the display.


I understand there are apps that measure signal strength, but this was a pretty basic setup and I was fine was a more ad hoc approach. It seems like every app is a new way to track or show ads anyway, and this prevented yet another app on my phone.
My office purchased “pico cells” - devices that produce a 5G signal over a small indoor area and transmit the traffic over your network to the provider. I positioned these on the opposite sides of the building that face cell towers and stuck the 5G “hockey puck” in the window. The pico cells made an impressive difference. Close by, my signal went from -110dBm to -65dBm and the zone that received better than -100 dBm extended out about 60 meters. I repeated the measurement to ensure I had good coverage and here I noticed that the phones tended to be “sticky” to a particular cell. Notice in the screen shot that the cellular tower ID is identified. Intuitively, one might expect the phone to “flip” to the next tower as soon as the signal was better but what I saw was that the phone tended to keep a tower until it’s signal got very weak.
Of course, the cellID will be useful if we have user coverage complaints. Each of the picocells reported a different ID and I noted those in our recordds so we can trace issues.