 a journal of interesting technical ideas . . .

The articles I post generally start out as a way to share something I’ve learned through years of experience. Less often, they are a way to share something that I’m researching currently. This one started out as a way to share with you how much I rely on Lucidchart and to recommend it, but in the course of reviewing options it became a way to share what I’ve learned.
I thought that options for creating diagrams on Linux were few and most of them were poor. What I found is that now (2021!) there are several good options and that all the tools have matured. I reviewed Creately, Dia, Draw.io, GNS3, LibreOffice Draw, Lucidchart, Pencil, SmartDraw, Visio, and yEd. About half are desktop applications and the other half web applications.
Diagrams are an essential part of IT. IT teams suffer with poor and out-of-date documentation and the biggest impediment to compiling it are usually the effort required to write and maintain. It’s also true that not everyone in IT enjoys writing.
Diagramming software solves this by allowing complex architectures to be summarized visually. Diagrams can pack a lot of detail, can be quickly understood, and relevant information is easily accessible. In short, being able to produce a clean diagram is a job requirement.
Diagramming software is different from “drawing” applications like GIMP because it includes icons that can be quickly placed on a page and connected, along with basic shapes and annotations. These shapes are layered, so you can bring one into the foreground, and the connecting lines are anchored to shapes so that the line endpoints move as shapes move. This workflow allows the production of well produced pictures with a minimal amount of effort.
The de facto standard here is Visio. Many of us have to exchange diagrams in a team, and for those folks, being able to import and export in Visio format is critical in the same way that any word processor should be able to work with *.DOC files.
My most typical use of this software is to produce network diagrams. Other common diagrams for me include flowcharts, swim lanes, and org charts. For purposes of this review, I’m focusing on network diagrams.
Each program was evaluated based on the following criteria. These are listed in order of importance.
This group includes Dia, GNS3, LibreOffice Draw, Pencil, Visio on WINE, and yEd. The default answer for many of us is Visio, but this recent review shows progress in the open-source competitors.
Visio is the standard, but it’s not made for Linux. I’ve been able to run 2010 using WINE without issues and 2013 with a little finessing. The current version (2019) is a little too automated for my taste - it keeps trying to guess what I want and gets in my way.
Visio checks all the boxes. It is compatible with Visio, obviously (with the cavaet that the new VSDX format is not supported). It has plenty of available stencils and most manufacturers produce their own additions. Visio will output to a ton of formats, including PDF and HTML. It is easy to annotate and you can create hyperlinks straight from icons (I have created links so that clicking a router opened a PuTTY session).
Cons for Visio are 1) it’s running under WINE, 2) you can’t run the later versions (but the 2010 and 2013 are plenty good), and 3) it’s expensive. Currently $270 from Amazon.
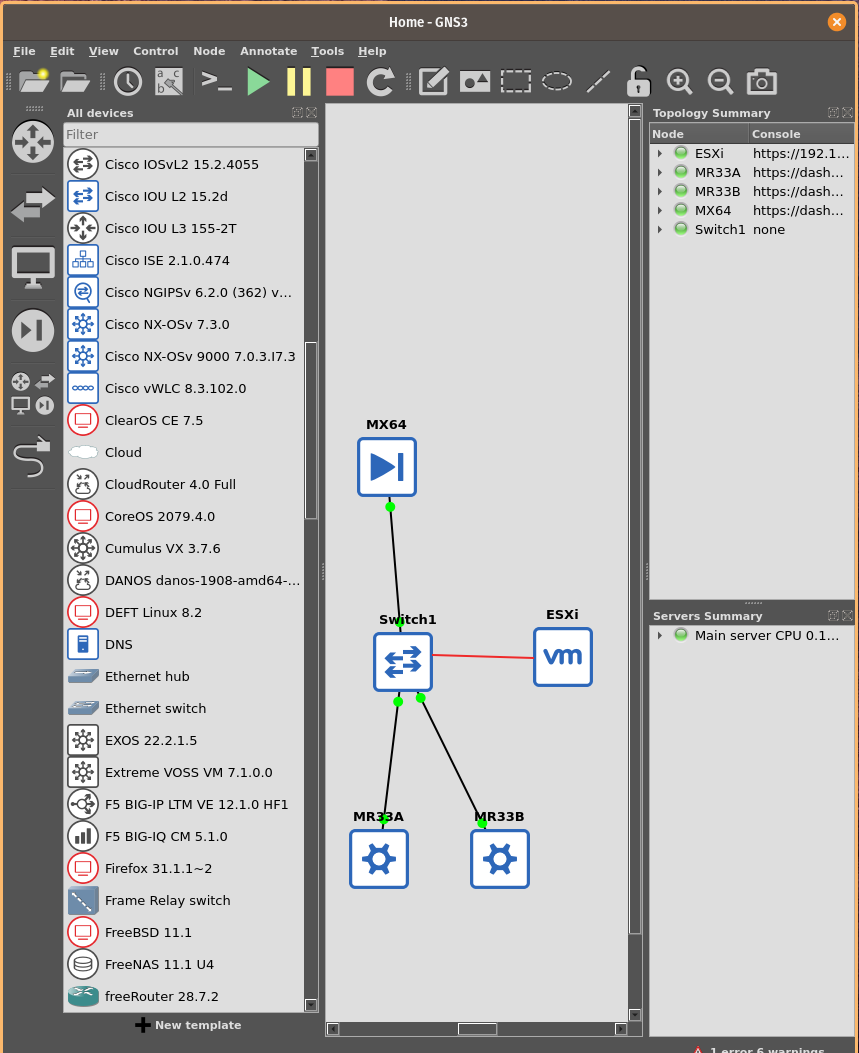
I included this as a lark because I recently wrote about creating hyperlinks in GNS3 and realized it could be used for this purpose. If you want to try this out, take a look at GNS3 HyperLinks. This is free and there are some good diagram primitives you can use, but it doesn’t work with Visio. Annotation and linking is fairly easy. Not great for this purpose, but it does work in a pinch!
For me, this can work very well for my home network. I’m not interested in exchanging it with other users, and it allows me to build a “live” image of the physical network outside the virtual GNS3 world. The two networks meet sometimes when I connect to the Internet or use a service like syslog.
Diagramming isn’t really what GNS3 is designed for and this probably isn’t the tool you’re loooking for.
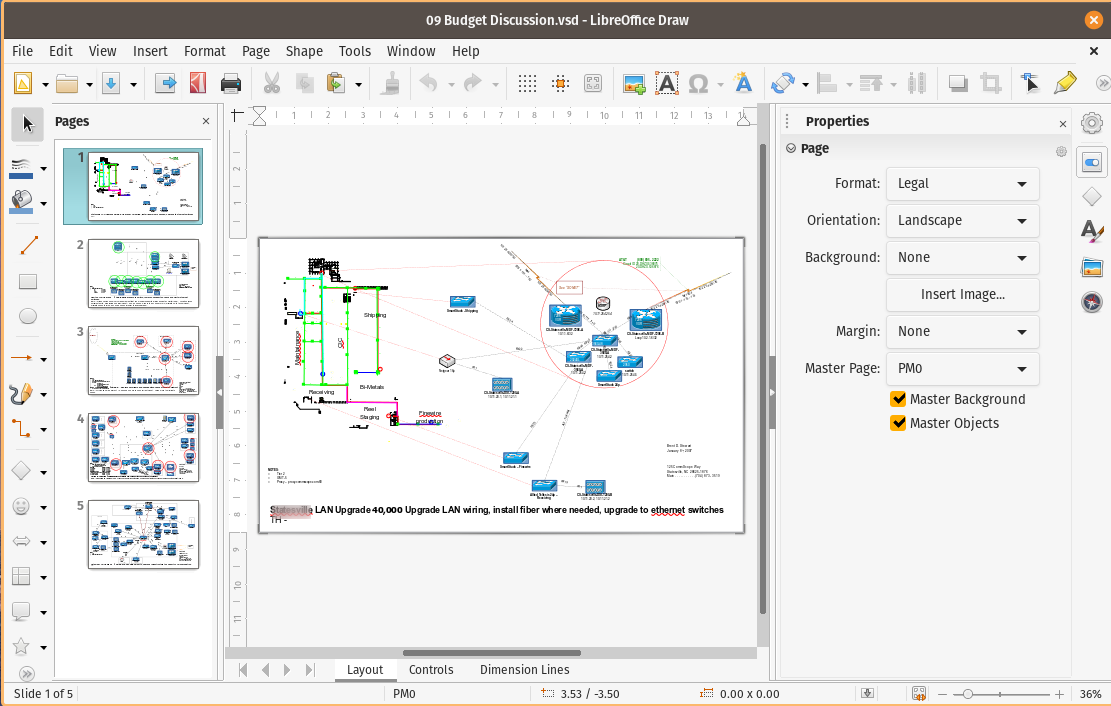
LibreOffice can import Visio files, but can’t export. The importing sometimes has errors - items that aren’t placed correctly or dimensions that are changed. In my opinion, this is an okay way to view and print more than a serious tool for creating. Even in the case of importing a picture into a text file, I’d export a PNG from something else to import into LibreOffice before trying to mess with Draw.
The Pencil project was something I used a few years ago and it showed a lot of promise. I remembered it and tried to include it in this review. If you are interested, grab executables from GitHub.
I messed around with compiling and tried the executable, but had issues with it running. It now starts, but never displays a window. It looks like there is active development, so I probably just tested at the wrong point. Nonetheless, I got tired of messing with it and never did get a chance to try it.
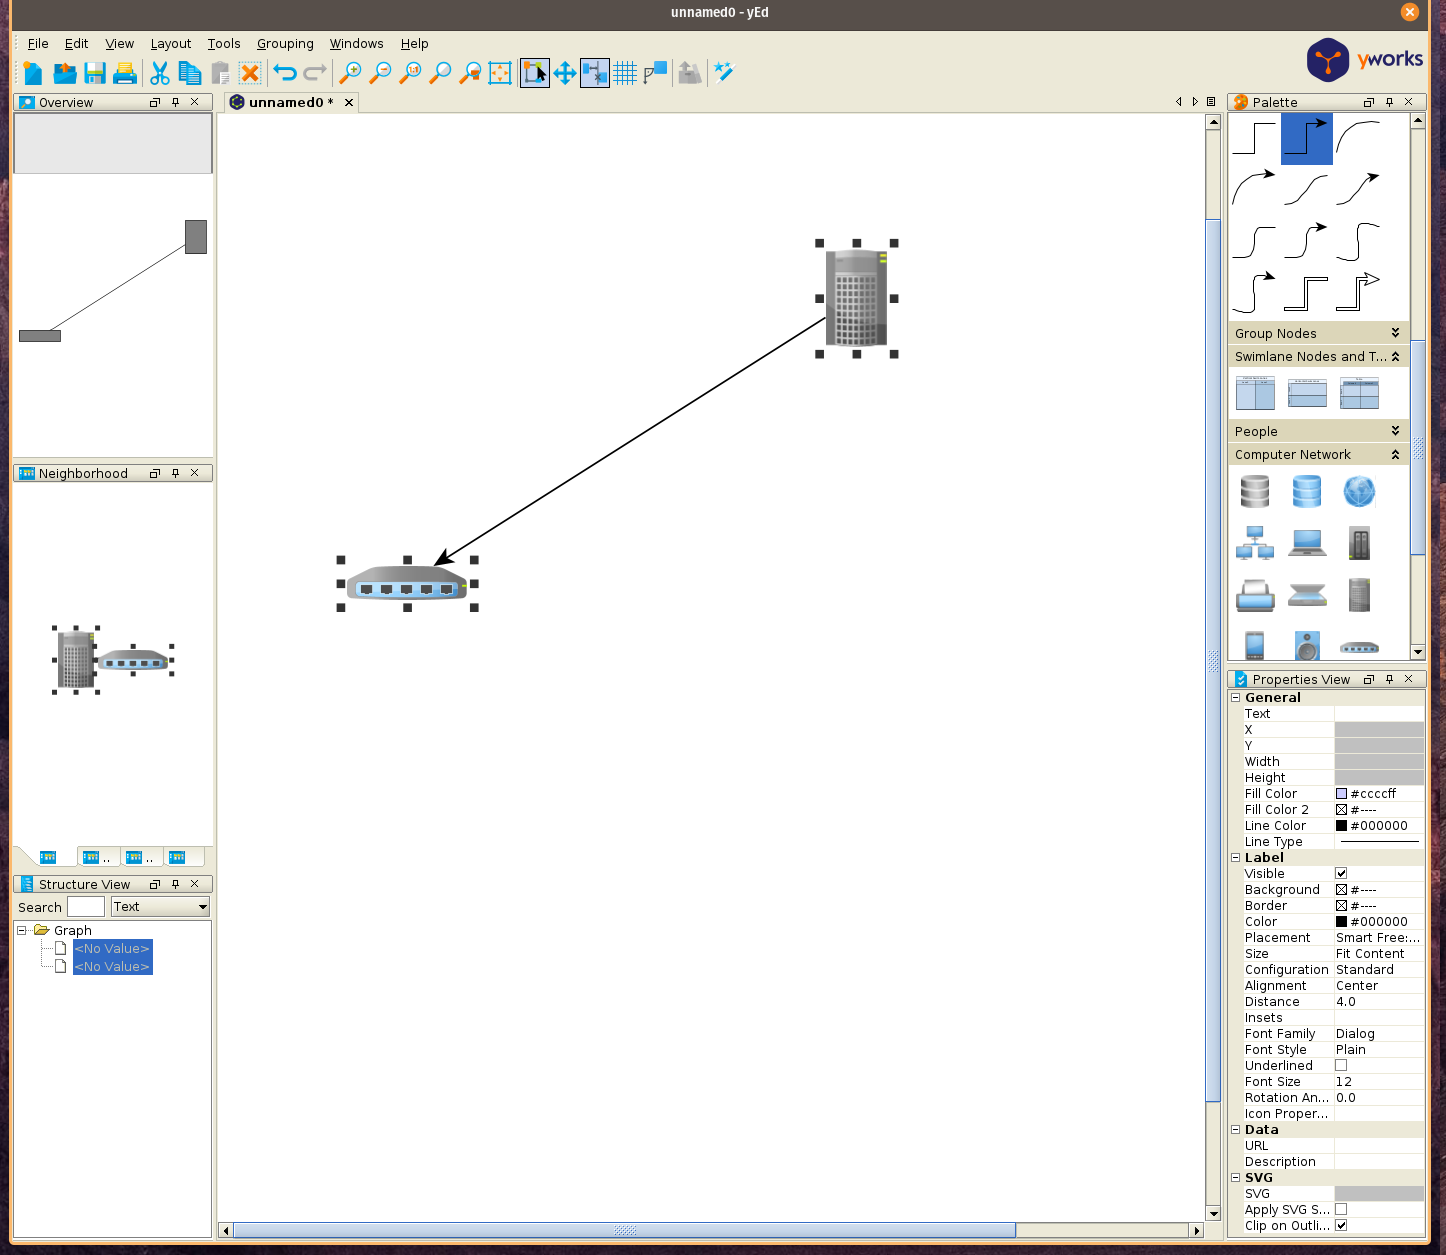
yEd exists as several editions - there’s a desktop version, a web version, and one designed to work with Confluence (Graphity). yEd is offered free, except in the Confluence tie-in model. This is a powerful and easy-to-use Java-based tool. The biggest knock on yEd is it’s inability to use Visio drawings or stencils. You can export to PDF and HTML though. I haven’t figured out a way to do Hyperlinking and you have to deal with a limited set of graphics primitives.
However, if you have simple diagramming needs this is an awesome tool. yWorks has provided a real service to the community by making this available for free. I’ve used it over the years and it’s always been solid.
From my perspective, it’s not as mature as other options but the price is right and it’s worth considering.
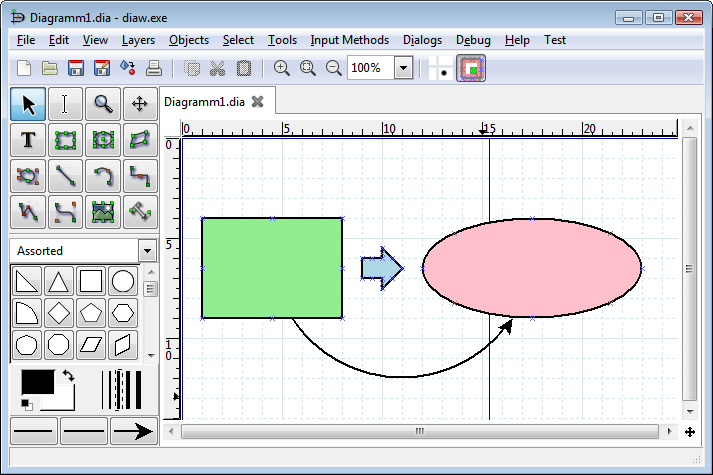
I haven’t used Dia as much - the last time I looked at it I was disappointed. Since then it’s added some support for Visio VDX files and a wealth of new templates. The interface has a much more solid feel and it is much easier to use.
I was able to quickly put together good-looking diagrams and came away impressed and appreciative about what the team has produced. That said, I had trouble importing and exporting Visio files when I tested. Annotation was less developed than Visio or Lucidchart - text couldn’t be rotated, icons couldn’t be labeled. I couldn’t create hyperlinks and I couldn’t import stencils.
This is a much improved project and it’s obvious they’re on the right track. For professional use, I don’t think it’s on the Visio or Lucidchart level. As a free application that is native to Linux, it seems great for more casual usage and bears further watching.
This group includes LucidChart, Draw.io, Creately and SmartDraw. Like the desktop category, significant work has been done here and there are new and exciting options.
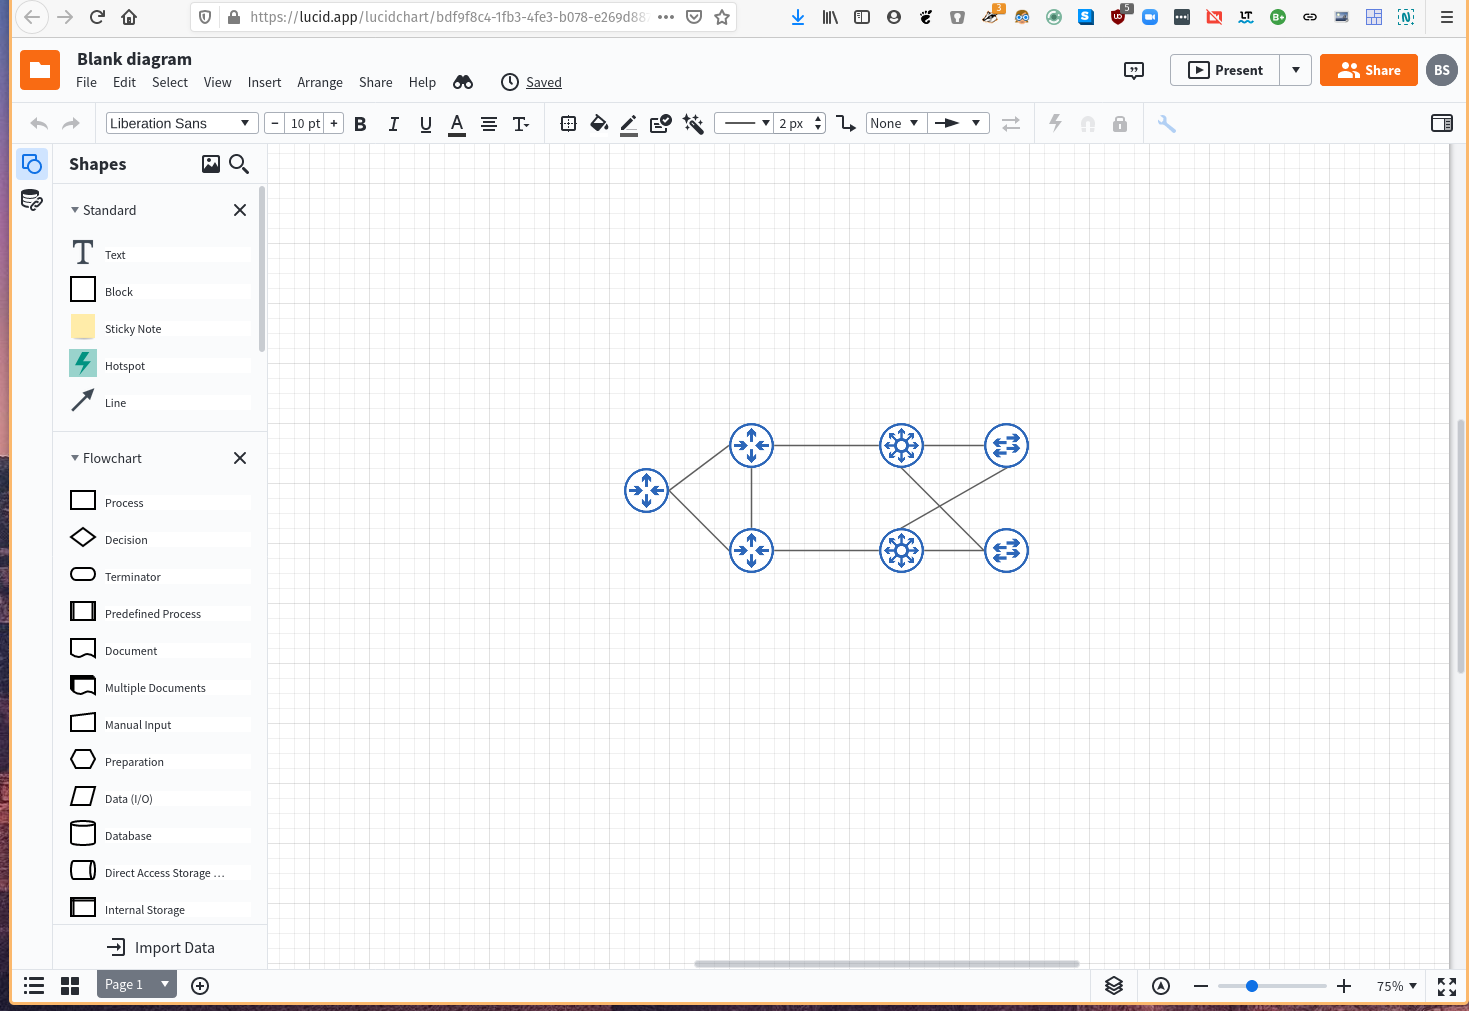
Lucidchart is a web service, using HTML5 and Javascript. Although it’s not technically written for Linux, it works well with most browsers.
I’ve had very good success with Lucidchart and I think it is on-par or better than Visio. It can import and export Visio files and stencils and can work with a variety of formats. It has superior features for annotation and you can easily create hyperlinks. There are a ton of stencils and templates. Lucidchart sends out an email each month that walks through example uses - I’ve picked up a lot of ideas from reviewing these emails.
You can use it for personal use for free. The individual plan includes a gigabyte of storage, includes tags and grouping, and unlimited objects. There are also team plans with more storage and a few more features. Lucidchart is a little cheaper than buying Visio and upgrading it every few years if you subscribe to an individual plan.
After a year of using it, I have come to appreciate Lucidchart more than Visio. I’ve even come to enjoy that it’s online, because this makes it easy to access my diagrams wherever I am. I particularly like the database/flat-file import option and find the annotation tools more flexible than Visio. The website is responsive, even over moderate links.
The con here is that you have to be online and it’s running in a browser, but ubiquitous access can also be a plus. Lucidchart has a free option, but an individual account is $9.95/mo or $108 per year.
Draw.io, like Lucidchart, is a webapp. It was another surprise in this recap. Since the last time I tested it, they’ve improved the Visio support so that it’s now possible to import and export! It’s a little rough because connections don’t flow smoothly and the layout is not precise, but it’s close and a very valuable addition.
Draw.io is responsive online and it supports real-tiome collaboration. You can save your work to a cloud provider or you can download it locally. The Visio support is a work in progress, so you can’t import stencils, but I could imagine working around that by importing a page with all my objects on it. The built-in stencils are horrible.
Draw.io allows hyperlinking to objects and annotation is easy to add and format. On the whole, it’s a rougher but similar experience to Lucidchart.
If you do occassional diagrams and don’t want to spend money, Draw.io is a very solid choice. Be prepared to do a little extra work, but it is sufficient.
Creately and SmartDraw are web SaaS packages. Both have free trail accounts available. Smartdraw personal accounts run $9.95 and Creately is $4.95 per month. Creately seems more limited in file formats, but interestingly has a desktop version available for Windows, Mac, and Linux. SmartDraw has the ability to import and export to major formats, including Visio. Both include stencil sets that are comprehensive and SmartDraw has a facility to import Visio stencils.
I tested Creately online and it’s quite good. The connectors worked really well and flowed in a visually attractive way. There was a full set of built in stencils, but I didn’t find any import features. The lack of Visio import and export is a big deal. I’m curious if that is resolved in the paid or desktop versions, but I was unable to verify that from the website.
I used SmartDraw for some sample diagrams. It seems well-built and easy to use, but I had trouble getting the connectors to work. It supports hyperlinking to objects and annotation was easy, but less flexible than Lucidchart.
My impression of SmartDraw was that it was responsive and fully featured, and I’m open to using it more. It felt a little less capable than Lucidchart, but that may just be that I’m much more familiar with Lucidchart. Worth checking out.
As for Creately, I was also impressed and some features seemed more developed than SmartDraw, but the lack of import/export features would limit my use.
If you are producing diagrams as part of your job, I would opt for Lucidchart. It seems to be the most mature option and it uses being a SaaS product to it’s advantage to make this information available across platforms and for collaboration within a team. It started as a Visio clone, but it’s mature enough to start forming an identity of it’s own and I prefer it. On Linux, this is an obvious option.
If you need to create diagrams, but you don’t need to share them (except as PNGs or such) then consider Dia. This is especially true if you want to use FOSS or want to use a local application. There are a lot of honorable mentions here - SmartDraw and Creately are at an analogous stage, Draw.io and yEd are free.
All told I’m very encouraged by my findings. This has gone from a sparse set of options that involved compromise to a rich group of choices that are starting to differentiate themselves.