 a journal of interesting technical ideas . . . a journal of interesting technical ideas . . .
Today, developers and content creators that maintain web applications are often looking out for ways to improve their site or web apps. This could be for High Performance (lower response time), Better Accessibility (consistent experience across all device types e.g. Tablet, Smartphone, PC), better Search Engine Optimization (SEO) score and other ways to improve the content by following industry best practices. There are many tools out there, which can be very expensive, and some have a steep learning curve.
I needed something that was very minimalistic, one that provides good information on issues that I can fix quickly and make my web application better. I came across Lighthouse.
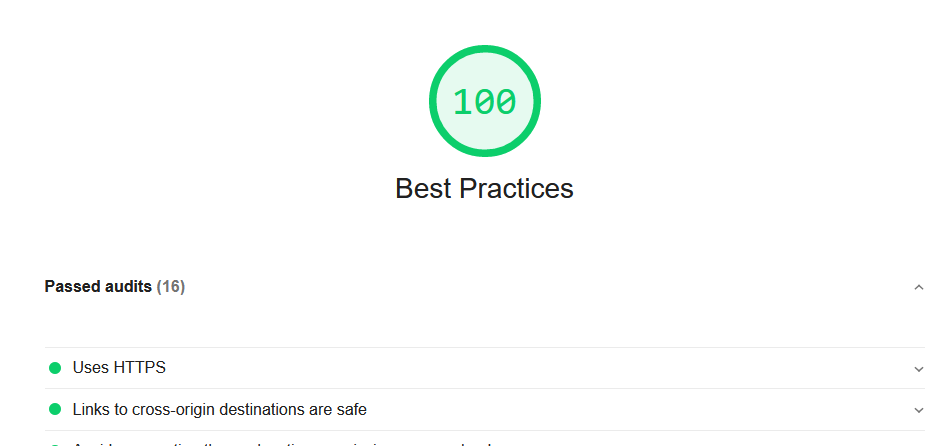
Lighthouse is a tool supported and backed by Google Developers that helps to measure performance and provide recommendations on how to fix some of the issues that are discovered. It is very minimalistic and powerful. Here is a snapshot of the scores and a set of recommendations it provides to improve the web content – I was amazed by this!
CLI Usage and Programmatic Access (requires Google Chrome Browser)
a. Install the Node.JS package, which matches your Operating System (OS) - https://nodejs.org/en/download/
b. Open a Terminal or Command Window and issue the command
NPM install -g lighthouse
c. To run a scan against a webpage, open terminal or command windows and issue:
lighthouse <url>
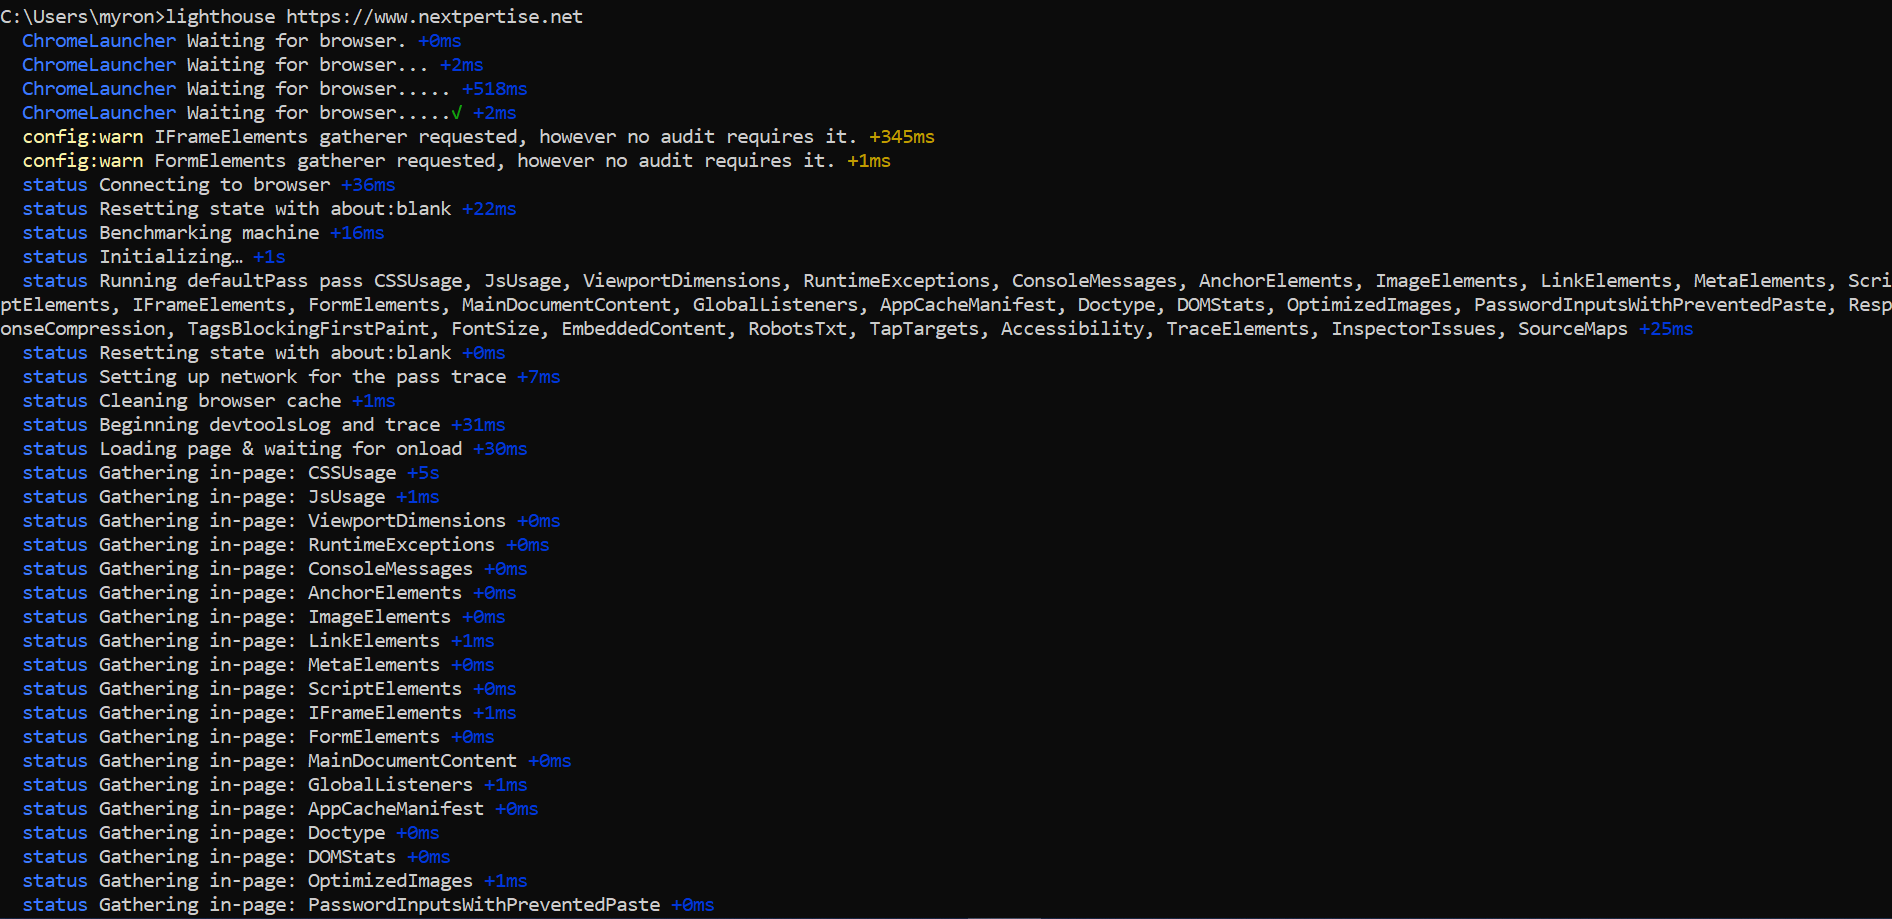
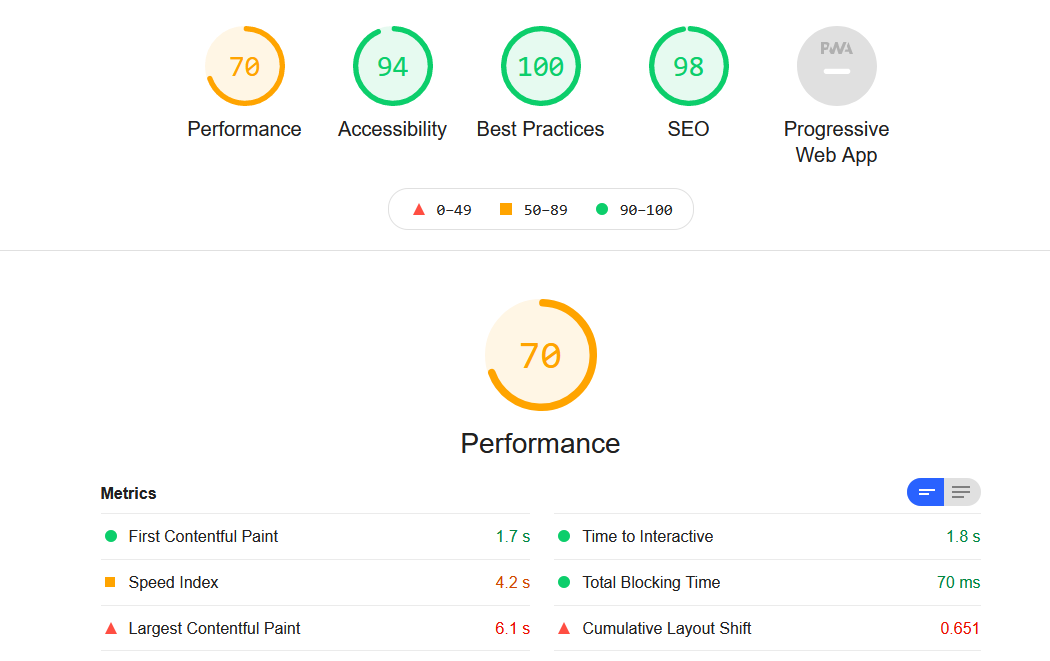
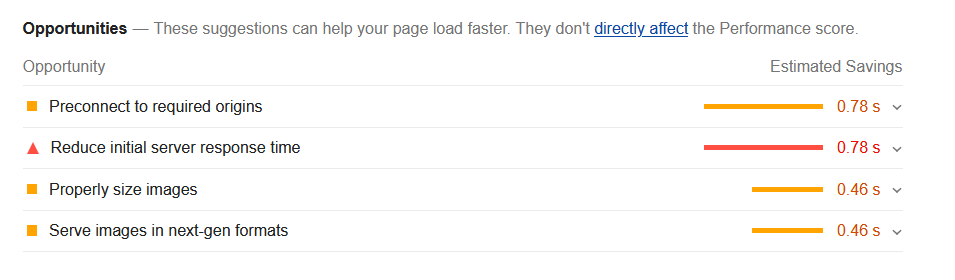
An HTML report is generated that shows the Performance and other metrics along with the recommendations on how fix potential issues.
You can setup scheduled commands or scripts to makes Lighhouse run on a daily or weekly basis, and generate the output as a CSV or JSON format, instead of HTML. Subsequently, you can use the CSV or JSON format and parse the data to setup thresholds and alerts to trigger when the data points deviate below the predefined threshold levels.
This way you can setup a repetitive process to monitor your web apps. You can also use the tool internally on your test environment and ensure that all the bugs and performance hindering elements are rectified before you move the web applications to a live environment.